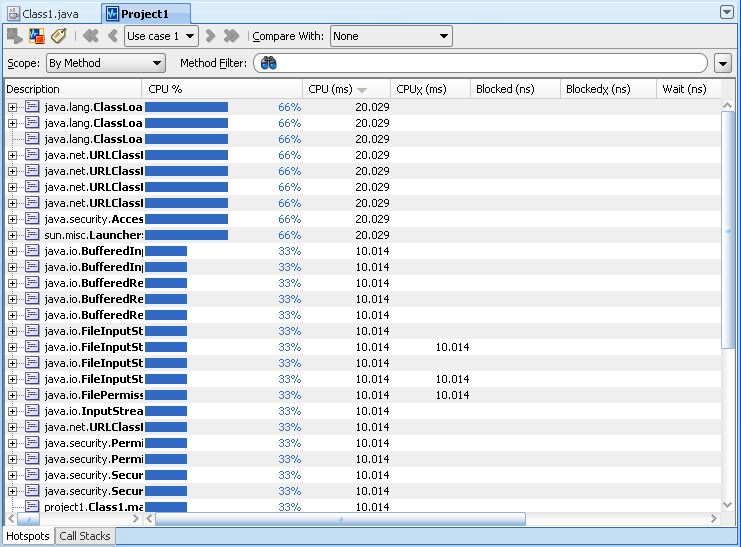
1. Hotspots 视图
排序显示在CPU取样时间内,所有方法占用的CPU时间。

2. Call Stacks 视图
显示在CPU取样时间内,按调用层次显示所有方法占用的CPU时间。
3. 参数说明
(1)CPU %:
Displays the percentage of the currently selected data column.
If the CPU column is selected, indicated by a downward-pointing triangle, this column is named CPU %.
If CPUx were selected, the column name would be CPUx %.
(2)CPU (ms):
Displays the cumulative amount of CPU time spent in seconds, in each method and all the methods it calls.
(3)CPUx(ms):
Displays the amount of CPU time spent in each method individually.
4. 典型案例
参考文献:
1. http://xmlandmore.blogspot.jp/2012/01/starting-cpu-profiler-in-jdeveloper.html


没有评论:
发表评论