1. 完成教程 《Create a Web Service from a Java Class 》,并确保在JDeveloper 内置的WebLogic Server 上运行成功。
2. 右击Project1,选择New>General> Deployment Profiles,选择WAR File。
名称:Rating_Web。
3. 建立指向独立的WebLogic Server的连接。
4. 发布Rating_Web到独立的WebLogic Server。
5. 访问 http://localhost:7001/Rating_Web/RatingServiceSoap12HttpPort?WSDL,WSDL内容能显示出来,说明发布成功。
6. 根据WSDL地址重新生成Web Service Proxy。
7. 修改RatingServiceSoap12HttpPortClient.java。
增加调用代码:System.out.println(ratingService.processRating("123456789"));。成功返回1。
2009年2月28日星期六
2009年2月27日星期五
JDev_020:使用JDeveloper 11g 发布EJB3.0
1. 完成教程 《Create a Simple EJB Session Bean 》,并确保在JDeveloper 内置的WebLogic Server 上运行成功。
重要步骤说明:
(1)创建一个Stateless、由Container管理事务的SessionBean。
(2)创建EJB Interface时,可以选择local或remote。
如果EJB客户端和EJB运行在同一个JVM中(比如通过Web Client调用EJB),最好选择local interface。
如果EJB客户端和EJB运行在不同的JVM中(比如通过Java Client调用EJB),则必须要选择remote interface。
(3)选择暴露sayHello()方法到local或remote Interface。
2. 右击Project1,选择New> General> Deployment Profiles,选择EJB JAR File。名称:HelloWorld_EJB。
3. 建立指向独立的WebLogic Server的连接。
4. 发布HelloWorld_EJB到独立的WebLogic Server。
5. 重新为HelloWorldSessionBean.java 生成一个 Java Client,指向独立的WebLogic Server。
6. 加入调用代码:System.out.println(helloWorldSession.sayHello( "world" )); 。
7. 测试通过。
参考文献:
1. 下载Project:SessionEJB.7z。
2009年2月26日星期四
JDev_019:使用JDeveloper 11g 发布Web应用(基于ADF、EJB、JPA、JSF)
1. 完成教程 《Build a Web Application with JDeveloper 11g Using EJB, JPA, and JavaServer Faces 》,并确保在JDeveloper 内置的WebLogic Server 上运行成功。
2. 右击EJBModel,选择New> General > Deployment Profiles,选择EJB JAR File。名称:HR_EJB。
3. 右击UserInterface,选择New> General > Deployment Profiles,选择WAR File。名称:HR_Web。
4. 右击EJBModel或UserInterface,选择New> General > Deployment Profiles,选择EAR File。名称:HR_App。HR_App要包括HR_EJB和HR_Web。
5. 建立指向独立的WebLogic Server的连接。
6. 发布HR_App到独立的WebLogic Server。
7. 访问http://127.0.0.1:7001/HR_Web/faces/browse.jspx。
问题1:访问http://127.0.0.1:7001/HR_Web/faces/browse.jspx时,出现错误:
Exception Description: Cannot acquire data source [java:/app/jdbc/jdbc/HRConnDS].
Internal Exception: javax.naming.NameNotFoundException: While trying to look up /app/jdbc/jdbc/HRConnDS in /app/ejb/HR_EJB.jar#HRFacade.; remaining name '/app/jdbc/jdbc/HRConnDS'
检查后发现是DataSource没有正确建立,于是先在Console中建立DataSource,Name:HRDS;JNDI Name:jdbc/HRDS。
然后,修改persistence.xml文件,把所有出现 java:/app/jdbc/jdbc/HRConnDS的地方,一律改成 jdbc/HRDS。
重新发布,访问应用,成功!
原因分析:是JPA EclipseLink搞的鬼,与设置 application scoped 或 globally scoped 有关,详细分析请参考:JNDI can not aquire datasource。
关于JPA EclipseLink,将另文专述。
2009年2月25日星期三
JDev_018:使用JDeveloper 11g 发布Web应用(基于JSF)
1. 完成教程 《Build a Simple JSF Application 》,并确保在JDeveloper 内置的WebLogic Server 上运行成功。
2. 右击Project1,选择New> General > Deployment Profiles,选择WAR File。名称:JSF_Web。
3. 建立指向独立的WebLogic Server的连接。
4. 发布JSF_Web到独立的WebLogic Server。
5. 访问http://127.0.0.1:7001/JSF_Web/faces/Start.jsp。
2. 右击Project1,选择New> General > Deployment Profiles,选择WAR File。名称:JSF_Web。
3. 建立指向独立的WebLogic Server的连接。
4. 发布JSF_Web到独立的WebLogic Server。
5. 访问http://127.0.0.1:7001/JSF_Web/faces/Start.jsp。
2009年2月23日星期一
JDev_017:使用JDeveloper 11g Debug 远程Web应用
开发运行环境:JDeveloper 11.1.2.3 + WebLogic Server 开发版12c(12.1.1.1.0)
1. Debug部署在JDeveloper自带的WebLogic Server上的Web应用
(1)右键page1.jspx页面,选择Debug,会启动Debug模式下的WebLogic Server。

Starting WLS with line:
C:\Oracle\Java\jdk1.6.0_25\bin\java -client -Xms256m -Xmx512m -XX:CompileThreshold=8000 -XX:PermSize=128m -XX:MaxPermSize=512m -Dweblogic.Name=DefaultServer -Djava.security.policy=C:\Oracle\JDev11.1.2.3\wlserver_10.3\server\lib\weblogic.policy -agentlib:jdwp=transport=dt_socket,server=y,address=49942 -Dcom.sun.xml.bind.v2.bytecode.ClassTailor.noOptimize=true -Djavax.net.ssl.trustStore=C:\Users\pmma\AppData\Local\Temp\trustStore1620035598097647834.jks -Doracle.jdeveloper.adrs=true -Dweblogic.nodemanager.ServiceEnabled=true -Xverify:none -da -Dplatform.home=C:\Oracle\JDev11.1.2.3\wlserver_10.3 -Dwls.home=C:\Oracle\JDev11.1.2.3\wlserver_10.3\server -Dweblogic.home=C:\Oracle\JDev11.1.2.3\wlserver_10.3\server -Djps.app.credential.overwrite.allowed=true -Dcommon.components.home=C:\Oracle\JDev11.1.2.3\oracle_common -Djrf.version=11.1.1 -Dorg.apache.commons.logging.Log=org.apache.commons.logging.impl.Jdk14Logger -Ddomain.home=C:\Oracle\JDEVRU~1\system11.1.2.3.39.62.76.1\DefaultDomain -Djrockit.optfile=C:\Oracle\JDev11.1.2.3\oracle_common\modules\oracle.jrf_11.1.1\jrocket_optfile.txt -Doracle.server.config.dir=C:\Oracle\JDEVRU~1\system11.1.2.3.39.62.76.1\DefaultDomain\config\fmwconfig\servers\DefaultServer -Doracle.domain.config.dir=C:\Oracle\JDEVRU~1\system11.1.2.3.39.62.76.1\DefaultDomain\config\fmwconfig -Digf.arisidbeans.carmlloc=C:\Oracle\JDEVRU~1\system11.1.2.3.39.62.76.1\DefaultDomain\config\fmwconfig\carml -Digf.arisidstack.home=C:\Oracle\JDEVRU~1\system11.1.2.3.39.62.76.1\DefaultDomain\config\fmwconfig\arisidprovider -Doracle.security.jps.config=C:\Oracle\JDEVRU~1\system11.1.2.3.39.62.76.1\DefaultDomain\config\fmwconfig\jps-config.xml -Doracle.deployed.app.dir=C:\Oracle\JDEVRU~1\system11.1.2.3.39.62.76.1\DefaultDomain\servers\DefaultServer\tmp\_WL_user -Doracle.deployed.app.ext=\- -Dweblogic.alternateTypesDirectory=C:\Oracle\JDev11.1.2.3\oracle_common\modules\oracle.ossoiap_11.1.1,C:\Oracle\JDev11.1.2.3\oracle_common\modules\oracle.oamprovider_11.1.1 -Djava.protocol.handler.pkgs=oracle.mds.net.protocol -Dweblogic.jdbc.remoteEnabled=false -Dwsm.repository.path=C:\Oracle\JDEVRU~1\system11.1.2.3.39.62.76.1\DefaultDomain\oracle\store\gmds -Dweblogic.management.discover=true -Dwlw.iterativeDev= -Dwlw.testConsole= -Dwlw.logErrorsToConsole= -Dweblogic.ext.dirs=C:\Oracle\JDev11.1.2.3\patch_wls1035\profiles\default\sysext_manifest_classpath;C:\Oracle\JDev11.1.2.3\patch_jdev1112\profiles\default\sysext_manifest_classpath weblogic.Server
java version "1.6.0_35"
Java(TM) SE Runtime Environment (build 1.6.0_35-b10)
Java HotSpot(TM) 64-Bit Server VM (build 20.10-b01, mixed mode)
Listening for transport dt_socket at address: 49942
Debugger connected to local process.
(2)在弹出的浏览器中,点击按钮“Click Me”,会激活断点。


2. 部署Web应用到独立的WebLogic Server上
(1)右键MyProject,选择Deploy


(7)

(8)通过JDeveloper 一键部署

(9)虽然连接WebLogic Server12c成功,但是部署时,总是报错,发布成war包,通过经过WLS Console发布也报同样的错误。
仔细检查后发现,是因为在weblogic.xml中Library Referece的版本不对。
<library-ref>
<library-name>jstl</library-name>
<specification-version>1.2</specification-version>
</library-ref>
<library-ref>
<library-name>jsf</library-name>
<specification-version>2.0</specification-version>
</library-ref>
因为我使用的是WebLogic Server 12c,而JDeveloper 11.1.2.3目前只支持到WebLogic 10.3。
去掉weblogic.xml中的Library Referece,重新通过WLS Console发布war文件,这次成功了。
2. Debug部署在独立的WebLogic Server上的Web应用
(1)修改Admin Server:Enable Tunneling

增加一行:set REMOTE_DEBUG_JAVA_OPTIONS=-Xdebug -Xnoagent -Xrunjdwp:transport=dt_socket,address=4000,server=y,suspend=n
修改set JAVA_OPTIONS行,修改后如下:
set JAVA_OPTIONS=%SAVE_JAVA_OPTIONS% %REMOTE_DEBUG_JAVA_OPTIONS%
修改完毕后,重新启动WebLogic Server,WLS Console会输出信息:
Starting WLS with line:
C:\Oracle\Java\jdk1.6.0_25\bin\java -client -Xms256m -Xmx512m -XX:CompileThreshold=8000 -XX:PermSize=128m -XX:MaxPermSize=256m -Dweblogic.Name=AdminServer -D
java.security.policy=C:\Oracle\wls1211_dev\wlserver\server\lib\weblogic.policy -Xverify:none -Djava.endorsed.dirs=C:\Oracle\Java\jdk1.6.0_25/jre/lib/endorsed;C
:\Oracle\wls1211_dev\wlserver/endorsed -da -Dplatform.home=C:\Oracle\wls1211_dev\wlserver -Dwls.home=C:\Oracle\wls1211_dev\wlserver\server -Dweblogic.home=C:\O
racle\wls1211_dev\wlserver\server -Dweblogic.management.discover=true -Dwlw.iterativeDev= -Dwlw.testConsole= -Dwlw.logErrorsToConsole= -Xdebug -Xnoagent -Xru
njdwp:transport=dt_socket,address=4000,server=y,suspend=n weblogic.Server
Listening for transport dt_socket at address: 4000
(3)修改Project的Run/Debug/Profiler,增加一个新的Run Configuration:RemoteDebug


(7)会弹出一个窗口,确认信息正确后,点击OK

JDeveloper Console输出如下信息:
Debugger attempting to connect to remote process at LocalHost 4000.
Debugger connected to remote process at LocalHost 4000.
说明已经成功连接到了WebLogic Server Debug端口4000。
(8)访问应用:http://localhost:7001/MyFirstApplication/faces/page1.jspx。
(9)在弹出的浏览器中,点击按钮“Click Me”,会激活断点。
(10)切换回JDeveloper,发现程序已经停留在第一个断点上了。
参考文献:
1. http://jdeveloperfaq.blogspot.com/2009/12/faq-4-how-to-remote-debug-adf.html
2. http://xmlandmore.blogspot.jp/2010/12/using-remote-debugging-in-jdeveloper.html
JDev_016:使用HotSwap功能Debug应用
开发运行环境:JDeveloper 11.1.2.3
1. 使用JDeveloper调试Java程序 非常简单,只要右键.java,选择Debug就可以了。
 2. 红色箭头指示当前到达的断点行。


1. 使用JDeveloper调试Java程序 非常简单,只要右键.java,选择Debug就可以了。
3. 点击Step Over按钮,会到达下一条语句。
可以看到Console中,已经输出了一条信息:0 woof Kate
C:\Oracle\Java\jdk1.6.0_25\bin\javaw.exe -server -agentlib:jdwp=transport=dt_socket,server=y,address=50191 -Dcom.sun.xml.bind.v2.bytecode.ClassTailor.noOptimize=true -classpath C:\Oracle\JDevRuntime\mywork\MyFirstApplication\.adf;C:\Oracle\JDevRuntime\mywork\MyFirstApplication\MyProject\classes;C:\Oracle\JDev11.1.2.3\modules\javax.servlet_1.0.0.0_2-5.jar;C:\Oracle\JDev11.1.2.3\modules\javax.jsp_1.2.0.0_2-1.jar;C:\Oracle\JDev11.1.2.3\modules\glassfish.el_1.0.0.0_2-1.jar;C:\Oracle\JDev11.1.2.3\oracle_common\modules\oracle.jsf_2.0\jsf-api.jar;C:\Oracle\JDev11.1.2.3\oracle_common\modules\oracle.jsf_2.0\jsf-impl.jar;C:\Oracle\JDev11.1.2.3\modules\glassfish.jstl_1.2.0.1.jar -Djavax.net.ssl.trustStore=C:\Users\pmma\AppData\Local\Temp\trustStore582542103810661307.jks myproject.Dog
Listening for transport dt_socket at address: 50191
Debugger connected to local process.
Source breakpoint: Dog.java:24
0 woof Kate
4. 点击Smart Tab,点击count变量,修改它的值=2。
5. 点击Resume按钮,会到达下一个断点处。
可以看到Console中,直接输出了:
Process exited.
Debugger disconnected from local process.
这是因为设置count=2后,经过++操作,count=3,因此跳出了for循环,没有输出count=1和2的语句。
Project 下载:MyFirstApplication.7z
参考文献:
1. http://docs.oracle.com/cd/E18941_01/tutorials/jdtut_11r2_50/jdtut_11r2_50.html
2009年2月22日星期日


2009年2月21日星期六
JDev_014:使用JDeveloper 11g 检查程序性能
使用 Run->CPU Profiler 可以帮助我们检查程序的性能。
1. Hotspots 视图
排序显示在CPU取样时间内,所有方法占用的CPU时间。
2. Call Stacks 视图
显示在CPU取样时间内,按调用层次显示所有方法占用的CPU时间。
3. 参数说明
(1)CPU %:
Displays the percentage of the currently selected data column.
If the CPU column is selected, indicated by a downward-pointing triangle, this column is named CPU %.
If CPUx were selected, the column name would be CPUx %.
(2)CPU (ms):
Displays the cumulative amount of CPU time spent in seconds, in each method and all the methods it calls.
(3)CPUx(ms):
Displays the amount of CPU time spent in each method individually.
4. 典型案例
参考文献:
1. http://xmlandmore.blogspot.jp/2012/01/starting-cpu-profiler-in-jdeveloper.html
2009年2月20日星期五
JDev_013:使用JDeveloper 11g 检查内存泄漏
使用 Run->Memory Profiler 可以帮助我们查看程序是如何使用Java Heap的,从而确定是否有内存泄漏。
1. Classes 视图
排序显示所有对象垃圾回收前后的所占内存大小。
2. Allocators 视图
按调用层次显示所有方法占用的内存大小。
3. 参数说明
(1)%:
The title of this column varies depending on which numeric column is selected.
For example, if the New column is selected, the title will be New %.
The column shows the percentage of the total of the selected column in the current row.
A bar graph (histogram) is drawn to the left of the numeric percentage.
(2)New:新创建的对象实例数
For a class, the number of objects of this class created in this use case.
For a method, the number of objects of this class created by this method or any methods it calls.
(3)Newx:
Applicable to methods only.
Displays the number of class objects created by this method.
(4)New Size:新创建的对象实例数所占的内存大小
For a class, displays the number of bytes used by newly created objects of the class.
For a method, displays the number of bytes used by objects of the class created by this method or any methods it calls.
(5)New Sizex:
Applicable to methods only. Displays the number of bytes used by class objects created by this method only.
(6)GC:被回收的对象实例数
Applicable to classes only. Displays the number of objects of this class garbage collected in the current use case.
(7)GC Size:被回收的对象实例数所占的内存大小
Applicable to classes only. Displays the number of bytes in objects of the class freed up by garbage collection.
(8)Initial Num:测试开始时的对象实例数
Applicable to classes only. Displays the number of objects of this class that existed when the current use case began.
(9)Initial Size:测试开始时的对象实例数所占的内存大小
Applicable to classes only. Displays the number of bytes used by objects of this class when the current use case began.
(10)Final Num:测试结束时的对象实例数
Applicable to classes only. Displays the number of objects of this class that exist currently for an active use case, or at the end of the use case.
(11)Final Size:测试结束时的对象实例数所占的内存大小
Applicable to classes only. The number of bytes used by objects of this class currently (for an active use case) or at the end of the use case.
(12)New-GC:新创建的对象经过GC后还剩的实例数
Applicable to classes only. Displays the number of newly created objects of this class that remain in the memory.
In other words, objects that were created by new but not garbage collected are reported.
At the end of a use case, this number may indicate a memory leak in the use case.
(13)New-GC Size:新创建的对象经过GC后还剩的实例数所占的内存大小
Applicable to classes only.
Displays the number of bytes used by newly created objects of this class that were not garbage collected.
4. 典型案例
listeners.add(new WeakReference(listener));
2009年2月19日星期四
JDev_012:使用JDeveloper 11g 审核你的代码
JDeveloper 11g中的Audit功能可以帮助我们审核代码。你甚至可以让JDeveloper 自动修复一些违反规则的代码。
Tools-->Preferences-->Audit,其中提供了如下测量手段:
1. 测量方法和类的复杂性
(1)V(G): Cyclomatic complexity。
测量一个方法中有多少个分支。
默认V(G) > 10的方法被认为是有问题的。
(2)DIT: Depth of Inheritance Tree。
测量一个类的继承深度。一般来说,java.lang.Object的DIT 为 1,直接 extends java.lang.Object的类的DIT为 2,以此类推。
默认DIT >6的类被认为是有问题的。
2. 测量方法、类、项目、工作区的大小
(1) NOS: Number of Statements。语句的个数。
选择Project或者要审核的代码,Build-->Audit ...
参考文献:
1. http://jdeveloperfaq.blogspot.com/2010/04/faq-19-how-to-check-and-improve-code.html
2. https://blogs.oracle.com/jdevextensions/entry/don_t_fear_the_audit
3. http://www.oracle.com/technetwork/developer-tools/jdev/index-098707.html
4. https://blogs.oracle.com/jdevextensions/entry/running_an_audit_from_the
5. http://soaora.blogspot.com/2010/11/jdeveloper-11g-audit-project-code.html
2009年2月18日星期三
JDev_011:使用JDeveloper 11g 重构你的代码
代码重构是一种改变代码结构而不改变代码行为的技术。
1. 引入变量:Refactor --> Introduce Parameter
选中字符串常量,如“Kate”,右键Refactor --> Introduce Parameter
输入要引入的变量名称:
完成后,会发现方法的定义和调用方法的地方全都自动引入了变量。
2. 抽取接口:Refactor --> Extract Interface...
选中类,然后右键Refactor --> Extract Interface...
选择接口中定义的方法
完成后,生成接口类。
3. 重命名:Refactor --> Rename
选中sayHi方法,右键Refactor --> Rename
把接口中的sayHi()方法,改名为sayHowDoYouDo()。
Log窗口会提示有哪些地方使用了该方法
完成后,会发现接口类和所有实现类中,sayHi方法都改成了sayHowDoYouDo。
1. 引入变量:Refactor --> Introduce Parameter
选中字符串常量,如“Kate”,右键Refactor --> Introduce Parameter

输入要引入的变量名称:

完成后,会发现方法的定义和调用方法的地方全都自动引入了变量。

2. 抽取接口:Refactor --> Extract Interface...
选中类,然后右键Refactor --> Extract Interface...

选择接口中定义的方法

完成后,生成接口类。

3. 重命名:Refactor --> Rename
选中sayHi方法,右键Refactor --> Rename

把接口中的sayHi()方法,改名为sayHowDoYouDo()。

Log窗口会提示有哪些地方使用了该方法

完成后,会发现接口类和所有实现类中,sayHi方法都改成了sayHowDoYouDo。


2009年2月10日星期二
JDev_009:定制自己的Update Center
JDeveloper中有个Update Center,可以下载官方和第三方提供的插件。

其实,你也可以增加自己的Update Center,方法如下:
点击Add,
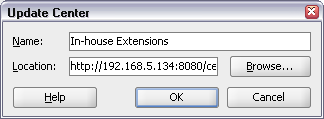
输入Name和Location,其中Location指向一个XML文件,内容如下:

可以看出,你可以增加多个update tag,每一个对应一个Extension。
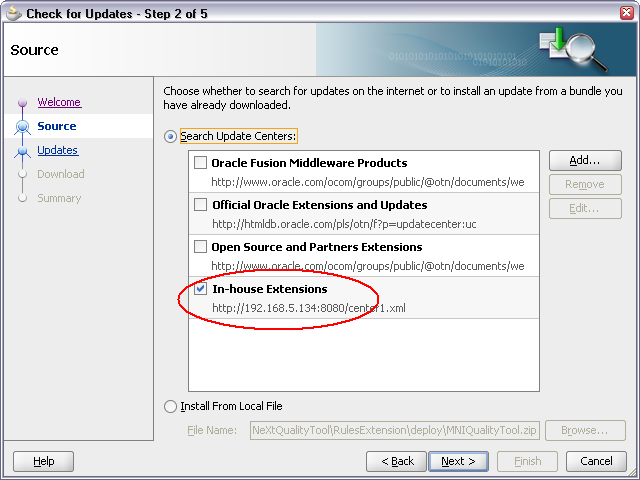
确认后,你的Update Center就出现在Update Centers中。

参考文献:
1. http://jdeveloperfaq.blogspot.jp/2011/02/faq-31-how-to-create-your-own-in-house.html
2009年2月9日星期一
JDev_008:JDeveloper 11g 开发环境设置 (4)
提升JDeveloper VM性能
# optimize the JVM for strings / text editing
AddVMOption -XX:+UseStringCache
AddVMOption -XX:+OptimizeStringConcat
AddVMOption -XX:+UseCompressedStrings
# if on a 64-bit system, but using less than 32 GB RAM, this reduces object pointer memory size
AddVMOption -XX:+UseCompressedOops
# use an aggressive garbage collector (constant small collections)
AddVMOption -XX:+AggressiveOpts
# for multi-core machines, use multiple threads to create objects and reduce pause times
AddVMOption -XX:+UseConcMarkSweepGC
参考文献:
1. http://bexhuff.com/2012/09/jdeveloper-memory-and-performance
2009年2月8日星期日
JDev_007:JDeveloper 11g 开发环境设置 (3)
开发环境:JDeveloper 11.1.1.5.0。
在开发SOA、BPM、WebCenter应用时,需要先安装对应Extension包才可以开发相应的应用。
本文介绍如何下载和安装Extensions。
1. 下载 JDeveloper Extensions
下载地址:http://www.oracle.com/technetwork/developer-tools/jdev/downloads/index.html。
这里给出的地址是JDeveloper下载地址,Extensions下载地址可以从这里访问。
注意下载时,必须选择和JDeveloper版本匹配的Extension版本。
以SOA Composite Editor Extension为例:
目前最新的Extension版本是:11.1.1.5.0.01.74。
要求JDeveloper版本范围是:min=11.1.1.5.37.60.13, max=11.1.1.5.99。
也就是说,目前的SOA Extension最高只支持JDeveloper11.1.1.5.0。
在JDeveloper中,选择Help-->About,查看JDeveloper版本:

2. JDeveloper Extensions 分三大类
(1)Oracle Fusion Middleware Extensions:融合中间件应用Extensions。
(2)Official Oracle JDeveloper Extensions:其它官方的Extensions。
(3)Partners and Open Source Extensions:Partner以及开源厂商提供的Extension。
一般来说,我们只需要用到第一类Extension。
3. 安装 JDeveloper Extensions
在JDeveloper中,选择Help->Check for Update...,选择从本地安装:
注意,尽量不要选择在线安装,那样速度会很慢。
4. 卸载 JDeveloper Extensions
在Help->About (Version/Extensions tab) 中可以查看所有已安装的extension。
在Tools->Preferences -> Extensions中可以去掉那些你不希望装载的extension。
但是在硬盘上仍然保留着这些extension,如果要彻底删除,需要到目录[jdeveloper_home]/jdev/extensions下手工删除相应的目录和jar。
同时,还要检查 [JDEV_USER_DIR]/tmp/update目录,手工删除相应的目录和jar。
在开发SOA、BPM、WebCenter应用时,需要先安装对应Extension包才可以开发相应的应用。
本文介绍如何下载和安装Extensions。
1. 下载 JDeveloper Extensions
下载地址:http://www.oracle.com/technetwork/developer-tools/jdev/downloads/index.html。
这里给出的地址是JDeveloper下载地址,Extensions下载地址可以从这里访问。
注意下载时,必须选择和JDeveloper版本匹配的Extension版本。
以SOA Composite Editor Extension为例:
目前最新的Extension版本是:11.1.1.5.0.01.74。
要求JDeveloper版本范围是:min=11.1.1.5.37.60.13, max=11.1.1.5.99。
也就是说,目前的SOA Extension最高只支持JDeveloper11.1.1.5.0。
在JDeveloper中,选择Help-->About,查看JDeveloper版本:
2. JDeveloper Extensions 分三大类
(1)Oracle Fusion Middleware Extensions:融合中间件应用Extensions。
(2)Official Oracle JDeveloper Extensions:其它官方的Extensions。
(3)Partners and Open Source Extensions:Partner以及开源厂商提供的Extension。
一般来说,我们只需要用到第一类Extension。
3. 安装 JDeveloper Extensions
在JDeveloper中,选择Help->Check for Update...,选择从本地安装:
注意,尽量不要选择在线安装,那样速度会很慢。
4. 卸载 JDeveloper Extensions
在Help->About (Version/Extensions tab) 中可以查看所有已安装的extension。
在Tools->Preferences -> Extensions中可以去掉那些你不希望装载的extension。
但是在硬盘上仍然保留着这些extension,如果要彻底删除,需要到目录[jdeveloper_home]/jdev/extensions下手工删除相应的目录和jar。
同时,还要检查 [JDEV_USER_DIR]/tmp/update目录,手工删除相应的目录和jar。
订阅:
博文 (Atom)